Attributing European Record temperatures of 2014
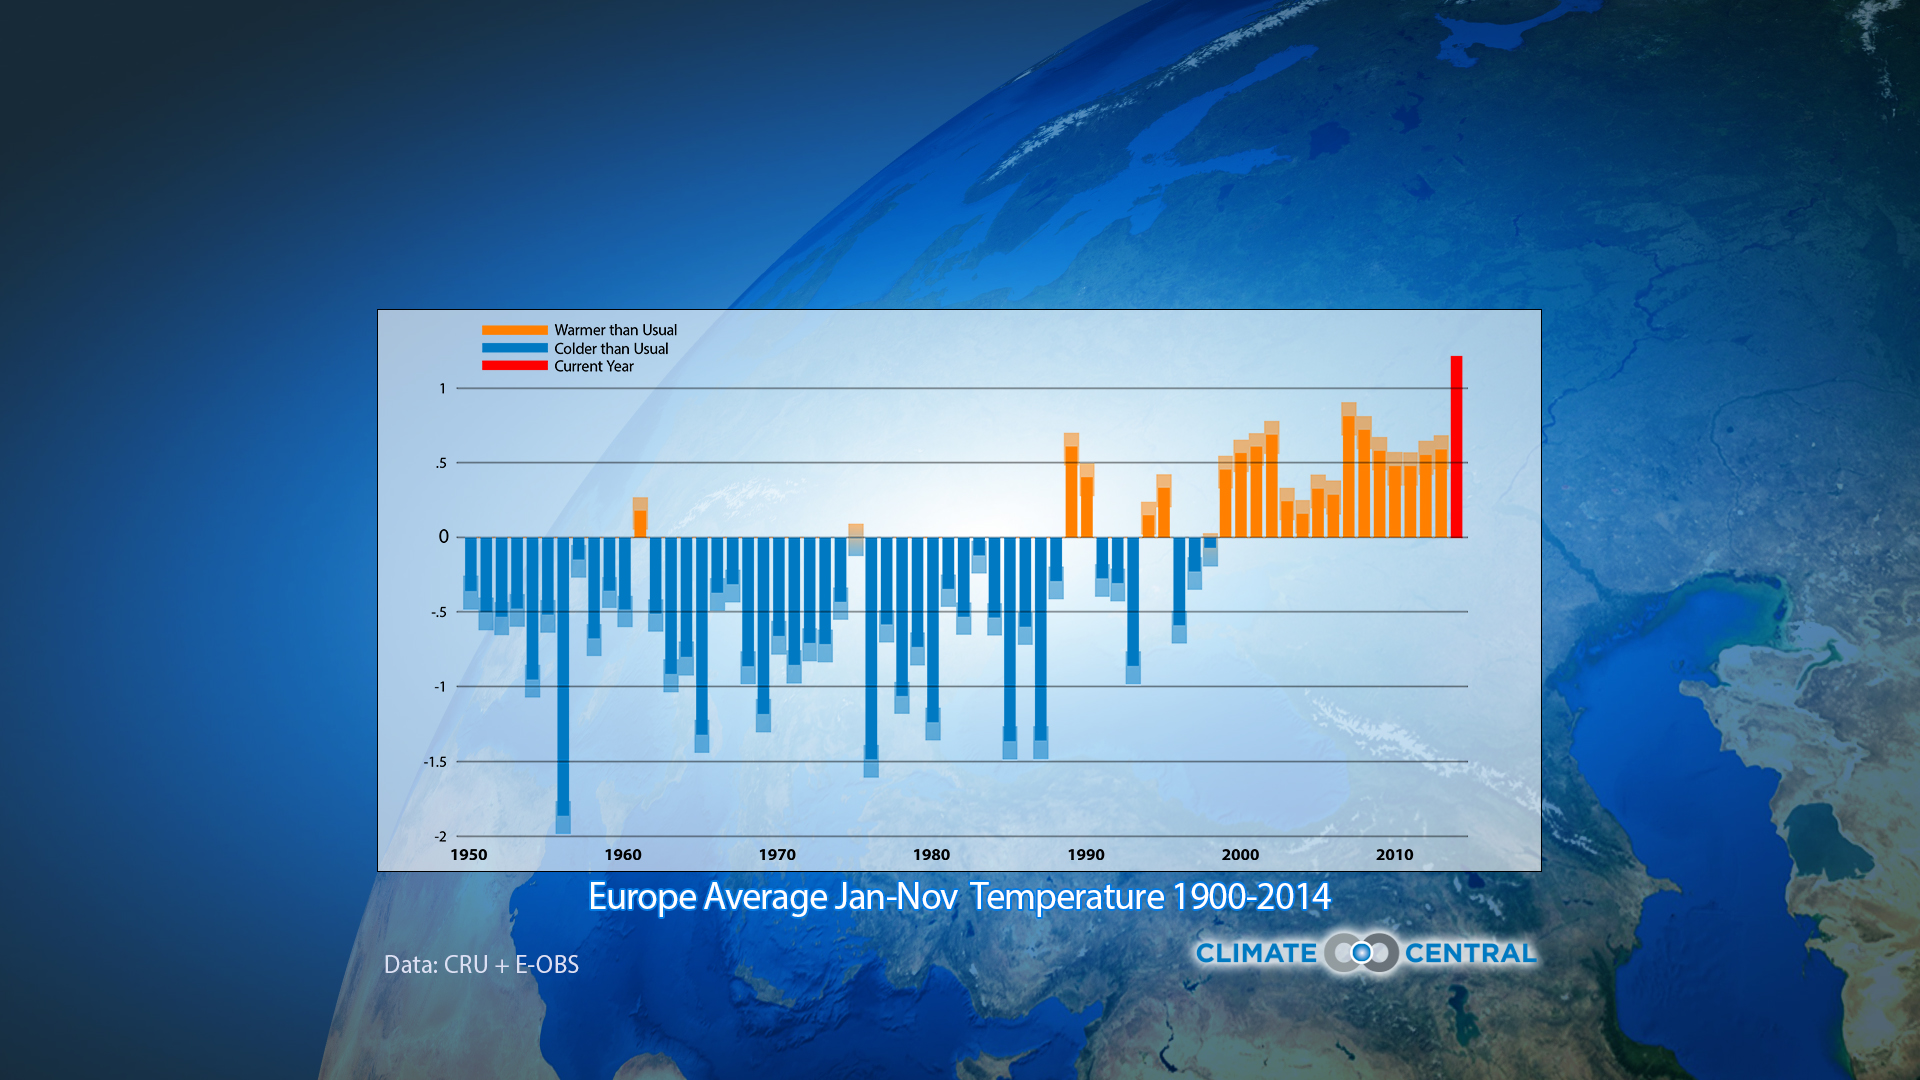
2014 broke the record for the warmest yearly average temperature in Europe. Attributing how much this was due to anthropogenic (man-made) climate change and how much it was due to natural variability is a challenging question, but one that is important to address. A new study which compares four different attribution methods including weather@home, indicates that each shows a very strong human influence on the European temperatures. However, the extent of this influence depends on a researcher’s definition of the event and the method used.
The resulting paper[1], led by Peter Uhe of the University of Oxford’s Environmental Change Institute and e-Research Centre, in collaboration with researchers at the Royal Netherlands Meteorological Institute, University of Melbourne and Climate Central, compares four event attribution methods to determine how much the record temperatures experienced in Europe in 2014 were due to climate change. The paper, ‘Comparison of Methods: Attributing the 2014 record European temperatures to human influences’ has recently been published in Geophysical Research Letters.
Using the 2014 temperatures as an example, the paper will form a foundation for future attribution studies of this type. It was conducted as part of the World Weather Attribution project run by Climate Central to accelerate the scientific community’s ability to analyse and communicate the possible influence of climate change on extreme-weather events such as storms, floods, heat waves and droughts.
Attributing increases in temperature
An increase in temperature puts strain on society, ecosystems, and infrastructure. So it is important to be able to determine to what extent, if any, man-made climate change has contributed to the frequency of temperature records being broken. Quantifying the impacts in this way helps us to begin assessing the socioeconomic costs of climate change.
The paper notes that record-breaking daily temperatures over Europe have increased in recent decades due to climate change – and record-breaking annual average temperatures, such as those experienced in 2014, are also expected to increase. Taken as a whole, these increasing temperatures have robustly been attributed to increasing anthropogenic greenhouse gas emissions, however attributing individual events to climate change is less straightforward.
When studying individual events there are a number of factors that can alter the findings, such as the assumptions made and the type of model used. Employing multiple methodologies provides a consistency check in the results between each method and leads to greater confidence in attributing human influence. The study contrasts the results of four methodologies, including using weather@home, when applied to the question: how much did anthropogenic climate change alter the likelihood of the European record temperatures of 2014? Each of the methods takes a different approach and involves slightly different assumptions regarding the modelling of anthropogenic influence on climate.
The results
The study examines the ‘risk ratio’, which is defined as the ratio between the probability of the event occurring in the actual world with climate change and the probability of it occurring in the world without human influence. (For example, a risk ratio of 10 means the event is 10 times more likely in the current climate compared to a world without climate change.) The study found that attribution over larger geographical areas tends to give greater risk ratio values. This highlights a major source of sensitivity in attribution statements and the need to define such events for analysis on a case-by-case basis.

Risk ratio calculated using the four different methods.
All of the methods showed a risk ratio of at least 500 for temperatures averaged over the whole of Europe – in other words, the extreme temperatures were 500 times more likely in the current climate compared to a world without climate change. The climate modelling techniques representing the world without human influence did not find any simulations as warm as observed in 2014. Statistical modelling based on the observations alone suggested that the gap between two such events in a ‘natural’ world would be likely to be at least 4000 years – compared to around every 30 years in the current climate.
However, as the impacts of most events are felt on a local rather than continental scale, a more meaningful way of looking at the risk ratio is to calculate it for small regions. For example, 2014 was especially warm in central Europe and Scandinavia but cooler in Portugal, Ukraine and the western part of Russia. Using an empirical model the risk return varied between less than 10 in Scandinavia, to between 10 and 100 in Europe, and more than 1,000 in Spain and France. The study showed that calculating the risk return locally gives a very different value compared to calculating it from the average European temperature.
The researchers found that the choice of region for analysis is particularly important, to avoid including effects that are not relevant for a particular study. Using the multi-model approach, the researchers can say with high confidence that the annual mean European temperatures have been made at least 500 times more likely by human-induced climate change – but this is only true for the continent as a whole, and not for individual regions. For an event defined by mean temperature, the exact choice of region can change the quantification of the risk ratio by an order of magnitude.
Resources:
[1] Uhe, P., F. E. L. Otto, K. Haustein, G. J. van Oldenborgh, A. D. King, D. C. H. Wallom, M. R. Allen, and H. Cullen (2016), Comparison of methods: Attributing the 2014 record European temperatures to human influences, Geophys. Res. Lett., 43, doi:10.1002/2016GL069568.
World Weather Attribution Analysis: https://wwa.climatecentral.org/analyses/2014-europe-heat/
« Back to News